Teaching finance in the digital age
Introduction
The unstoppable algorithmic transformation of financial services has seen the financial technology (FinTech) industry surge from the sidelines to the mainstream1. FinTech is broadly defined as a permanent technology revolution that is changing the way we do finance2. FinTech is multidisciplinary and is moving from the technological era of SMAC3 to a future where DARQ4 technologies are the next differentiator combination. For students to remain relevant in this fast-paced world, computation needs to be a central tenant in their Finance education.
While finance is a social science, many parts of modern finance are fundamentally quantitative, with financial practitioners solving practical problems using innovative technologies. Furthermore, the rise of big and alternative data combined with the exponential growth of AI and financial data science has created new opportunities in the financial sector. The application is now widespread including areas of risk management(Unknown 2020af), portfolio construction(Unknown 2020ac), investment banking(Unknown 2020ab) and insurance(Unknown 2020ar). In short, the * algorithmisation* of finance is unstoppable.
While narrow AI, which uses rule-based algorithms, has dominated the fast-paced automation of tasks and finance, the next wave of automation will be digitising judgment calls (Unknown 2020ah). Given that finance professionals have an essential fiduciary duty towards their clients, the rapid growth of artificial intelligence (AI) in finance has highlighted some critical risks around trust, overfitting, lack of interpretability, biased inputs and unethical use of data. Now more than ever, highly computationally digitally literate finance graduates are needed to balance AI and financial machine learning with sustainability, ethics, bias, and privacy to create trustworthy data-driven decisions (Unknown 2020ai).
The UK is leading the way in Financial Technology (FinTech) innovation and are forging on with a large scale plan post-Brexit. The recent Kalifa Review of UK Fintech sets out an ambitious 5 point plan to foster and scale UK based Fintech firms. A central part of this plan is to upskill, and reskill adults by developing training and courses from high-quality universities. So now more than ever, there are exciting opportunities for computationally literate finance graduates in the UK.
This paper provides an overview of the opportunities and challenges for the Finance education curricula in the fast-paced world of financial technology innovations. We specifically focus on econometrics and the emerging field of economic machine learning and embed computation as a central tenant to allow for a frictionless approach to teaching. We provide an overview of how this has been achieved in the Management School of Queens University Belfast using an enterprise-scale cloud computing infrastructure and a suite of enterprise-level web software.
Background
What is financial machine learning?
Machine learning has been adopted at a pace in many real-world applications but has been slow to develop in areas of scientific research, especially economic analysis, where traditional econometric techniques dominate. Leading econometricians argue this is due to a clashing culture (Unknown 2020c), where some financial economists view the ontological differences in econometrics and machine learning as intractable. This naive comparison highlights the epistemological challenges computer age statistical inference faces in a world of rapid algorithmic development (Unknown 2020v). Financial machine learning is a subfield of AI in its infancy, attempting to reconcile the differences between econometrics and machine learning.
Machine learning is a branch of nonparametric statistics mixing statistical learning, computer science and optimisation (Unknown 2020al), where algorithms have three fundamental building blocks:
- A loss function
- An optimisation criteria
- An optimisation routine
Changes in each of these building blocks produce a wide variety of learning algorithms characterising the freedom they have to learn patterns in the data5. Econometrically, these models possess bias due to their optimisation of a restricted objective according to a specific algorithmic methodology and statistical rationale. On the other hand, econometrics applies statistics to a data sample, usually in the form of regression analysis, to examine relationships. The model design uses well-journeyed economic theory to develop an unobservable hypothesised model. The asymptotic theory is then relied upon to produce objective statistical inference, which minimises bias, possibly at the expense of increased sampling variation.
Financial machine learning attempts to resolve three broad conflicts between machine learning and econometrics(Unknown 2020ag):
- The importance of statistical inference;
- Causality;
- A prior hypotheses and model assumptions.
Statistical inference
Statistical inference is a broad discipline at the intersection of mathematics, empirical science and philosophy. Since its philosophical beginnings through the publication of the Bayes rule in 17636, computation has been a traditional bottleneck for applied statistical inference frameworks. It has motivated small sample solutions with solid asymptotic principles.
Traditional econometrics retained much of this framework arguable because of the sparsity of data to proxy the realisation of theory. Until the early 1950s, computation had been a traditional bottleneck for applied statistics(Unknown 2020v). More recently, increases in power and accessibility of computing have seen machine learning techniques being adopted for statistical inference7
Statistical inference is the bedrock of econometrics, while the main focus of machine learning is prediction. In traditional econometrics, models learn statistical information and uncertainty about the underlying data generating process parameters, using a priori probability model under strict assumptions with a proven track record. Armed with this theoretical confidence and using the dominant frequentist approach, econometricians can objectively infer uncertainty and variation characteristics about how well the data sample maps to the theoretical data generating process.
There is a significant faith in probability theory for distributional assumptions and model specifications to be amenable to statistical inference. The three most assumed properties in most traditional econometrics models are linearity, additivity and monotonicity. The most important assumption is validity and can be summarised as:
The data you are analysing should map to the research question you are trying to answer. This assumption sounds obvious but is often overlooked or ignored because it can be inconvenient. Optimally, this means that the outcome measure should accurately reflect the phenomenon of interest, the model should include all relevant predictors, and the model should generalise to the cases to which it will be applied. - (Unknown 2020x)
These generative formulations provide a convenient root to statistical significance using p-values (Unknown 2020ag). Unfortunately, the inherent philosophy of traditional econometric models is incompatible with out-of-sample inference and prediction (Unknown 2020q).
In contrast, machine learning models focus on outcome prediction, where the data generated process is generally undefined, with the goal of algorithmically optimisation models to fit the underlying data generating process as well as possible (Unknown 2020ag). (Unknown 2020v) summaries this well in their definition of computer age statistical inference
Very broadly speaking, algorithms are what statisticians do, while inference says why they do them. However, the efflorescence of ambitious algorithms has forced an evolution (though not a revolution) in inference, the theories by which statisticians choose among competing methods.
For inference to be convincing in financial machine learning, more work must be done on statistical consistent feature importance measures, emphasising in-sample parameter sensitivity analysis and out-of-sample explanations for parameter predictive influence. In recent years, mainly in the statistics discipline, there have been some advances in this area, for instance, second-generation p-values(Unknown 2020j, 2020aw), Shapley value(Unknown 2020at, 2020aa), and bootstrapped neural network parameter p-values (Unknown 2020r, 2020s)
Causality
Identifying causal effects with data has a long and varied history. It’s origins span many disciplines, including early statisticians (Unknown 2020w), economists (Unknown 2020y, 2020aq), geneticists (Unknown 2020av), and even computer scientists (Unknown 2020am). We can view causal inference as using theory and expert institutional knowledge to estimate the impact of events or decisions on a given outcome of interest (Unknown 2020p). A naive assumption would be that prediction algorithms in machine learning cannot provide the rigour of empirical econometric design in extracting causal inference. But there is a growing sub-field of machine learning which tackles causality in two ways. Firstly, it can improve the predictive power of traditional econometrics by decoupling the search for relevant predictors from the search for specification (Unknown 2020ah). Secondly, machine learning can play a key role in discovering new financial theories beyond the reach of traditional methods, such as a new theory in market microstructure that was used to predict the 2010 flash crash (Unknown 2020u).
Hypotheses, assumptions and cultural clashes
Traditionally, machine learning is data-driven, while econometrics is hypothesis-driven, where valid inference from testing stands on model assumptions being the ground truth asymptotically. Over 20 years ago, the Berkeley statistician, Leo Breiman, lambasted the statistical community for their dogmatic approaches in the face of emerging algorithmic techniques to statistical science successes. He framed his argument as a culture problem where
…the statistical community has been committed almost exclusively to data models…where one assumes that a given stochastic data model generates the data. (Unknown 2020k)
For the most part, the statistical community has now accepted machine learning (ML) as a standard part of statistical science, with graduate-level standards incorporating ML techniques alongside the traditional statistical approaches (Unknown 2020z, 2020v) and leading statisticians exposing their benefits for enhancing scientific discovery (Unknown 2020as).
While the statistics community has moved on, the economics and econometrics community has been much slower to depart from the strictness of data-generating models which embody consistency, normality and efficiency. The econometric canon pre-dates the dawn of digital computing, with models devised for estimation by hand. These are legacy technologies that need updating for the digitally savvy graduates of the future.
ML approaches do not naturally deliver these theoretical properties, but leading econometricians argue that if their discipline is to remain relevant for students, a balance must be struck between using data to solve problems8 while preserving the strengths of applied econometrics (Unknown 2020c). Encouragingly, recent advances in theoretical properties of machine learning models published in econometrics(Unknown 2020b, 2020au, 2020d, 2020e) and applied statistics journals (Unknown 2020aw, 2020a).
The boundary between econometrics and ML is subject to much debate (Unknown 2020ag). However, in applied work, the reality is much more nuanced, with many methods falling into both camps. For instance, the bootstrap facilitates statistical inference and ensemble methods, such as the Random Forest algorithm.
Classical econometrics requires a model that incorporates our knowledge of the economic system, and ML requires us to choose a predictive algorithm with reliable empirical capabilities. Justification for an inference model typically rests on whether we feel it adequately captures the essence of the system. Likewise, the choice of pattern-learning algorithms often depends on measures of past performance in similar scenarios. Thus, inference and ML can be complementary in pointing us to economically meaningful conclusions.
Brief history of computing in finance and the cloud
For centuries, finance and computation have gone hand in hand, with quantitative finance taking its roots from Bachelier’s Theory of Speculation (Unknown 2020f). Computing as a utility can be traced back to Professor John McCarthy in the early 1960s. As computing power has become more accessible and affordable, computation has become a central part of finance. Figure 1 illustrates some of the critical moments in the development of computing in finance and the cloud.
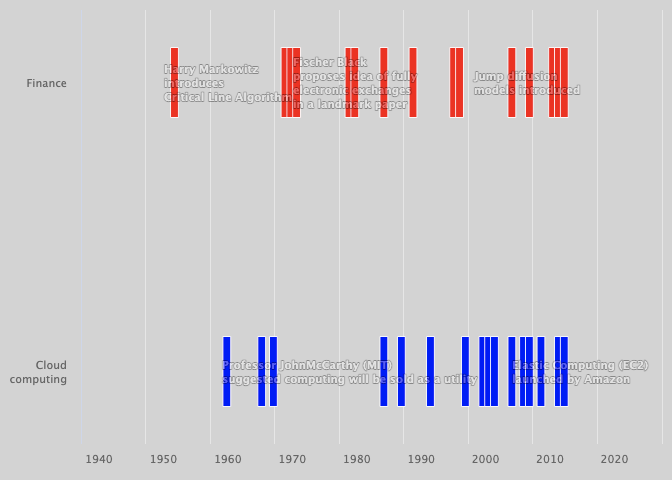
On the buy-side, in the early 1950a, Harry Markowitz transforms quantitative approaches to portfolio management. For example, Markowitz solved a complex mean-variance portfolio optimisation problem using algorithmic programming. Meanwhile, in the early 1960s Ed Thorp and John Simons, using computer-aided statistical algorithms, showed how arbitrage opportunities, unseen by traditional hedge fund managers, could be exploited to beat the market* consistently *.
On the sell-side a game-changing breakthrough in the 1970s was a model to price derivative products (Unknown 2020i, 2020ak) (BSM model), resulting in the explosive growth of options markets (Unknown 2020l). Subsequently, weaknesses in the BSM model fuelled growth in financial computing. Quantitative researchers, with the increased availability of computing power, used more realistic continuous-time pricing models to estimate complex partial differential equations (Unknown 2020an).
Teaching environment for computing
Much like teaching statistics and data science, embedding computing in a financial analytics course has three interconnected teaching advantages:
- Produce interesting output with data (and code) within the first ten minutes of the first class; A have a knock-on effect of challenge students to infer meaning from data and statistics from day one;
- Get students to think about computation as an integral part of the finance curriculum(Unknown 2020ad, 2020m))
- Demystify the folk theorem of statistical computing where students think that changing the computing environment improves their output;
A standard solution is to use computing labs to facilitate computation exercises. However, one downside to this approach is that instructors usually do not have administrative access and therefore struggle to accomplish basic maintenance tasks, such as pre-loading module-specific content. Furthermore, this usually leads to a familiar environment for all courses, rather than specialised setups for more advanced computational methods. Finally, the most significant downside is that using computing labs discourages active engagement of computation in all aspects of the module.
Our approach has been to use a browser-based cloud computing solution to provide a frictionless student experience in lectures and workshop sessions. Using the sizeable academic discount, we use the RStudio Teams enterprise software packages and manage student access using a container farm of dockerised instances. The Workbench product of the Teams suite (formerly RStudio server pro) is the web server software that allows online access to several integrated development environments (IDEs)9 to script in both R and Python (Unknown 2020ap).
Compared to the computer labs approach, our approach has three distinct benefits:
The passive lecturing then active labs are replaced by dynamic lectures and labs and 24/7 access to computing for active independent learning; Help students who have cost constraints or limitation to accessing computing hardware; Ease of sharing code, data and environments.
Why R and Python?
R and Python are the two leading languages used in the industry for data analysis. Thus, to best prepare students to be competitive and perform on the job market, we made the explicit decision to teach both languages at master level10. Although some notable holdouts teach econometrics using commercial graphical user interfaces(GUI), these languages have infiltrated academia. Proponents of GUI-based econometrics teaching argue that teaching statistical concepts is less intimidating to beginners when using a point-and-click approach than command line methods. Furthermore, the argument goes that teaching programming and statistics in tandem creates too much friction for students.
In our experience, such convenience is only possible by removing data analysis from the course content and providing students with tidy, rectangular data. But for modern financial data analytics, this approach is a disservice to students. Furthermore, point-and-click procedures require a bespoke student user manual that can run to 40-plus pages.
We argue there is a significant learning curve for the novice student, which isn’t generalisable to other analytics workflows. In general, using a GUI copy and paste workflow can increase student frictions, be more error-prone, be harder to debug, and, most importantly, disconnect the logical link between computing from financial analytics(Unknown 2020h). But, perhaps most important is that by learning generalisable coding/data skills, a student an adequately prepared to into an industry where technologies are rapidly evolving.
Why RStudio Teams?
Figure 1 visualises the components that make up the RStudio Team bundle.

RStudio describes this product as follows:
RStudio Team is a bundle of RStudio’s enterprise-grade professional software for scaling data science analytical work across your team, sharing data science results with your key stakeholders, and managing R and Python packages. RStudio Team includes RStudio Workbench, RStudio Package Manager, and RStudio Connect. RStudio Team offers convenience, simplicity, and savings to organisations using R, Python and RStudio at scale.
- (Unknown 2020ao)
Teams is an enterprise-grade setup offered free of charge for academic teaching. This discount is a significant saving for educational budgets, typically between $15,000 to $20,000. The School’s budget can then focus on purchasing an agile computing infrastructure.
For teaching computation, the IDE is the most critical tool in this bundle. The Workbench product comes with Jupyter (notebook and lab) and RStudio native IDE, which provide a powerful interface that helps flatten the learning curve in command line teaching. It has a series of panes to view data, files, and plots interactively. Additionally, since it is a full-fledged IDE, it also features integrated help, syntax highlighting, and context-aware tab completion.
Students access the RStudio IDE through a centralised RStudio server instance, which allows us to provide students with uniform computing environments. Furthermore, the IDE integrates directly with some critically essential tools for teaching best practices and reproducible research, such as R Markdown, Docker, and Git version control.
Importantly, we do not dissuade students from creating local instances of R and Python, but we do not want it to be a prerequisite of any module. Students are then allowed to progressively develop their setup to know that fully-fledged instances are always departmental resources.
Remote RStudio Workbench Platform
A popular approach to running a centralised RStudio server in teaching computation in higher-level statistics courses is to build a shared infrastructure with high powered computation power. This hardware is usually housed securely on-premises and managed by a dedicated IT team. For example, the Duke University statistics department purchased and operated a powerful farm of computer servers that can serve approximately 100 students per semester (Unknown 2020m). We have chosen to run RStudio Workbench using virtualised hardware on the Microsoft Azure cloud. Figure 3 shows the architecture of the current setup (without dockerisation). Each student is assigned a Linux account, authenticated using a departmental login. Students then connect to a single RStudio Workbench instance, and via the Launcher, the software can open an IDE to access Python or R scripting environments. Thus, each student experiences a similar computing environment solving the perennial. but it worked on my machine? problem.
The primary advantage of running and managing a cloud computing platform is control. Lecturers control a shared user environment for each course, including required packages, resource configuration, remove or kill sessions and monitor resource demand on the system. This management work adds a considerable burden to the lecturer and the IT support, partially offset by the time saved supporting the build of lab-based PCs. However, our experience and student feedback suggest that the benefits far outweigh these additional costs. Furthermore, not providing students with such a resource is a disservice to their employability in the modern world of finance.

Containerisation in finance
Linux containers are technologies that allow you to package and isolate applications with their entire runtime environment (Unknown 2020g). Their strategic advantage is their application independence from the underlying operating environment enabling standardisation and automation, significantly lowering cost and operational risk.
Virtualisation technology is the underlying element of cloud computing, and containers take this to the next level. Cloud computing has traditionally used virtual machines to distribute available resources and provide isolated environments among users. The key difference between virtual machines and containers is that containers share the same underlying operating system (Unknown 2020aj)
Containerisation is decades old, but the emergence of the open-source Docker Engine has accelerated the adoption of this technology. Docker is a lightweight virtualisation technology that allows sharing one operating system so that all code, runtimes, tools, and libraries needed for a piece of software are made available. This build once run anywhere property makes them highly portable, agile and efficient approach to running sandboxed instances of RStudio Workbench. The open-source nature of Docker makes it a transparent and powerful tool for reproducible computational finance research. From a teaching perspective, each student can be mapped to a single container, secluding individual operates and maintaining strict control of computing resource usages to provide accidental disruption of individual student’s work.
Furthermore, clusters can be deployed using a container orchestration system such as Kubernetes, and the operational overhead can be largely automated using AKS. Given they are much lighter weight than VMs, a large container farm of RStudio instances can be run concurrently on one single server. We plan to build this infrastructure into our platform and have sketched out the planned setup in figure 4.

One big challenge with Kubernetes is its steep learning curve, and even though Azure offers an automating management service, an administrator will still need to manage individual instance housekeeping. For this reason, we opted for a more straightforward approach used in Duke University’s statistical department and was created by Mark McCahill. He kindly shared his setup (https://gitlab.oit.duke.edu/mccahill/docker-rstudio), which we use to create a strict sandboxed virtual environment for each student.
Course implementation
We piloted our new infrastructure at masters level teaching in the 2020-2021 academic year at Queen’s Management School. Named Q-RaP (Queen’s management school Remote analytics Platform), students used the platform in two modules; algorithmic trading and investment and time-series financial econometrics. Anecdotally, it received excellent feedback from students, especially when remote teaching and learning was the norm. In 2021/2022, it will be used in a further two masters level courses (research methods in finance and computational methods in finance) and available for some business analytics modules. As well as the teaching advantages, the resource has the additional benefit of easing the demand pressures on computer labs.
Reproducibility with computational notebooks
Computational notebooks are documents that combine code, discussion and output in a dynamic reproducible format. An essential advantage of computational notebooks is that they embody the PPDAC credible analysis workflow (Problem, Plan, Data, Analysis, Communication). PPDAC is the professional standard for data analysis and plausible inference(Unknown 2020as). Unlike the copy and paste approach, all five parts of the PPDAC approach can be included in one document, providing an enhanced level of transparency, portability and reproducibility.
There are two main formats for producing computational notebooks; Jupyter notebooks and R Markdown. Both are based on Markdown, one of the most popular markup languages in computing. Using Markdown is different from using a WYSIWYG editor. In an application like Microsoft Word, you click buttons to format words and phrases, and the changes are visible immediately. In contrast, when creating a Markdown-formatted file, you add Markdown syntax to the text to indicate which words and phrases should look different. Markdown is highly portable, platform-independent, future proof, and essential for the modern financial data scientist.
Out of the box, the Jupyter ecosystem supports python scripting using the IPython kernel but can support up to 100 different languages (called ‘kernels’) by installing additional kernels11. Jupyter notebooks are a lightweight, low learning curve approach to teaching computing and are an excellent way to get non-technical students up and running in the first 10 minutes of a course. R Markdown is probably one of the most powerful tools in the RStudio IDE. R Markdown files are plain text documents that combine text, code and YAML metadata into an authoring framework for financial analytics. In the RStudio IDE, you can open an. Rmd file and working interactively, or render the file to build a static report or a dynamic web app using the Shiny packages. For instance, when you render an R Markdown document, it will combine the text with output from your code. The rendering process produces static formats such as HTML, pdf and word, but it can also produce interactive dashboards, web apps, slide shows, websites and more technical documentation (See video below). We mainly use Python and R code chunks in our teaching, the former output in the RStudio environment using the reticulate package.
Pedagogically, the main benefit of R Markdown and Jupyter notebooks is to embed the logical connection between computing and financial data analysis. This approach is sometimes referred to as literate programming (Unknown 2020ae)12, which made code, output and narrative inseparable. Computational notebooks have four advantages over the copy-and-paste approach:
- Combining code and output in one document makes it easier for a student to locate the source of the errors and encourages more experimentation;
- Strict uniformity of the reporting template makes it easier for the lecturers to grade;
- Collaboration and group projects become much easier for students when using version control. Version control also provides a strict tagging system of individual contribution is assessed within a group work setting;
- Provides a baseline template document that, as students learn, can be more and more lightweight.
- By removing the scaffolding in a slow, piecemeal way as the course progresses, active learning appeals.
On balance, using literate programming via computational notebooks has meaningful learning and employability benefits, especially as it is becoming a standard approach to collaboration in the finance industry.
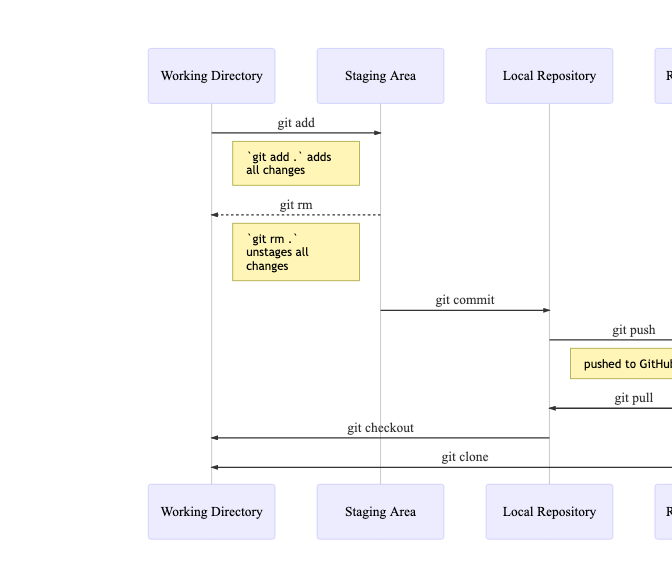
Version control, git and GitHub
Increasingly, in the world of computational finance, version control is being used to disseminate and promote innovative coding solutions to financial problems. Furthermore, in line with applied statistics curricula (Unknown 2020m), modern finance curricula should strive to have students produce reproducible output. Git is a popular command-line version control tool that integrates well with RStudio Teams. In addition, GitHub is a web-based hosting repository platform that provides access control and many more collaborative features to manage teamwork on computing projects.
From a finance industry employability perspective, in the past, there has been considerable resistance to the user of externally hosted IT services as security is paramount to highly regulated financial institutions. The opposition has typically been for strategic and economic reasons:
- For companies that have swallowed the Windows Koolaid there are more secure options such as Mercurial
- It is cheaper for large companies to do it in house
- In a large organisation, there are guaranteed to be fiefs all wanting to do things their way and a standardised version control system is the only appeal of there is an obvious Total Cost of Ownership benefits. These arguments are now outdated, especially with Big Tech acquisition activity in the git ecosystem space. For example, in 2018, Microsoft bought GitHub and soon after Alphabet’s Google Ventures took a significant stake in GitLab. This has propelled git version control as an industry standard that is now easily integrated into all legacy systems, including Windows Servers.
Students are required to use git for all assignments in the classroom, where GitHub is a central repository where students can upload their work and provide feedback. Recently GitHub Classroom was introduced, providing an enterprise-level service free of charge for academic teaching.
Before GitHub classrooms, GitHub management tools such as organisation and teams can be set up privately so that only the students or the group of students can see and contribute to the assignment. For example, we used a model where each module has a separate organisation to which students are invited at the beginning of the semester. For group work, the teams' tool allows creating a separate team-based repository with finer-grained access control. In addition, the instructor can monitor each student’s progress and contribution with administrative access through the continuous integration functionality. GitHub classroom provides automated instant feedback on simple process tasks, for example, checking for common reproducibility mistakes in R Markdown submissions. Feedback on larger prediction projects can be automated using instant accuracy scores and live leader-boards similar to a Kaggle contest (Unknown 2020m).
Much of what has been described above has now been automated in GitHub Classroom and can also be integrated into learning management systems such as Canvas. The learning curve for these tools is unavoidable. It can be high for introductory-level courses, but a basic understanding of the workflow in Figure 5 is sufficient for most modules.
Discussion
As finance educators, our primary objective is to foster industry-ready graduates for the fast-paced digital age. As we enter a new phase in the development cycle of financial technology, exposing students to industry-standard computing technologies is a good start. Our goal with Q-RaP is to reduce the frictions of teaching computation in finance. Our vision is to expand this platform to all quantitative modules in the Management School.
Pedagogically, by embedding computation in a centralised frictionless way, we can spend more time developing the essential communications skills for explaining the why of the output from the code and data. Teaching econometrics and statistics in business schools is a considerable challenge, especially with students from non-technical backgrounds. The traditional approach off-the-shelf textbook exercises using mathematical formulas only serves to disenfranchise students from statistical computing further and is a disservice to the modern business school graduate. We find the learning curve is significantly flattened by a code-first approach, increasing student buy-in with approachability and usability. In addition, mathematical formulas can be introduced to build a deeper understanding of statistical plumbing and critical thinking around limitations.
The infrastructure and toolkit we described above ensure buy-in by making computing a central component of courses and assessments. Using GitHub as the sole course management tool forces students to become familiar early, ensuring questions and problems are dealt with at least before the first assignment date. Furthermore, requiring students to submit assignments using R Markdown forces students to using a literate programming approach, ensures reproducibility and embed the PPDAC principles in their work. Finally, from an employability perspective, indoctrinating students early with these reproducibility and workflow principles inoculates any bad computational habits forming, which are much harder to retrain out of financial researchers.
Importantly, we want to enable students and colleagues to centralise computation in frictionless and agile education. We hope this can result in a more meaningful approach to solving business problems with data in a more thoughtful, transparent and significant matter. But, perhaps most important is that by learning generalisable coding/data skills, a student an adequately prepared to into an industry where technologies are rapidly evolving.
Unknown. 2020a. “Apley2020.”
———. 2020b. “Athey2017.”
———. 2020c. “Athey2019a.”
———. 2020d. “Athey2019b.”
———. 2020e. “Athey2019c.”
———. 2020f. “Bachelier1900.”
———. 2020g. “Banker2017.”
———. 2020h. “Baumer2014.”
———. 2020i. “Black1973.”
———. 2020j. “Blume2019.”
———. 2020k. “Breiman2001.”
———. 2020l. “Cesa2017.”
———. 2020m. “Cetinkaya-Rundel2018.”
———. 2020n. “Chamberlain2000.”
———. 2020o. “Chamberlain2020.”
———. 2020p. “Cunningham2021.”
———. 2020q. “De_Prado2019.”
———. 2020r. “Dixon2020.”
———. 2020s. “Dixon2020a.”
———. 2020t. “Dreze1972.”
———. 2020u. “Easley2020.”
———. 2020v. “Efron2016.”
———. 2020w. “Fisher1936.”
———. 2020x. “Gelman2020.”
———. 2020y. “Haavelmo1943.”
———. 2020z. “Hastie2009.”
———. 2020aa. “Heskes2020.”
———. 2020ab. “IBC2020.”
———. 2020ac. “Jaeger2021.”
———. 2020ad. “Kaplan2007.”
———. 2020ae. “Knuth1984.”
———. 2020af. “Lin2017.”
———. 2020ag. “Lommers2021.”
———. 2020ah. “Lopez_de_Prado2018.”
———. 2020ai. “Mahdavi2020.”
———. 2020aj. “Mavridis2019.”
———. 2020ak. “Merton1973.”
———. 2020al. “Molina2019.”
———. 2020am. “Pearl2009.”
———. 2020an. “Reisinger2018.”
———. 2020ao. “RStudioT2021.”
———. 2020ap. “RStudioW2021.”
———. 2020aq. “Rubin1974.”
———. 2020ar. “SOA2020.”
———. 2020as. “Spiegelhalter2019.”
———. 2020at. “Sundararajan2020.”
———. 2020au. “Wager2017.”
———. 2020av. “Wright1934.”
———. 2020aw. “Zuo2021.”
-
“A progress report on fintech’s record-breaking year” by Nicholas Megaw August 2021. gated link ↩︎
-
social, mobile, analytics and cloud ↩︎
-
distributed ledger technology, artificial intelligence, extended reality, Quantum computing ↩︎
-
Boardly speaking, machine learning algorithms are categorised into unsupervised learning and supervised learning. A classic example of the form is clustering, and the latter is a regression tree. Reinforcement learning, a popular technique for financial data, is in between these two extremes of unsupervised learning (no feedback at all) and supervised learning that can be viewed as feedback by providing the correct labels. Instead, partial feedback (in the form of rewards) encourages the desired behaviour without instructing the algorithm precisely what to do as supervised learning (Unknown 2020r). ↩︎
-
Which was used by early advocates to argue the existence of God ↩︎
-
One notable example is the bootstrap a computer-intensive inferential engine that is now ubiquitous in applied statistics ↩︎
-
This is framing econometrics as decision making under uncertainty(Unknown 2020t, 2020n, 2020o) ↩︎
-
To date, the software ships with a Launcher package that facilitates access to Jupyter notebooks, Jupyterlab, RStudio IDE, and Visual Studio ↩︎
-
At present, MSc in Quantitative Finance uses both languages, and we hope to expand this to all finance programmes and the new Actuarial Science masters in the future ↩︎
-
https://jupyter4edu.github.io/jupyter-edu-book/jupyter.html ↩︎
-
Donald Knuth is pioneering in the computing world and create the vastly popular TeX typesetting markup language ↩︎
Barry Quinn
Professor of Finance & Financial Technology, Director, Centre for Finance and Responsible Technology
Professor of Finance & Financial Technology and Director, Centre for Finance and Responsible Technology, Ulster University. Chartered Statistician working on applied statistics, AI, and evidence for markets and regulation.